

When a server starts to feel slow, the fastest way to find out why is the terminal. This guide to linux system monitoring covers three classic command-line tools – top, htop and vmstat – and explains what the numbers on screen actually mean. It is written for developers and small-team admins who run a VPS or cloud VM: no expensive software, just tools already on your machine.
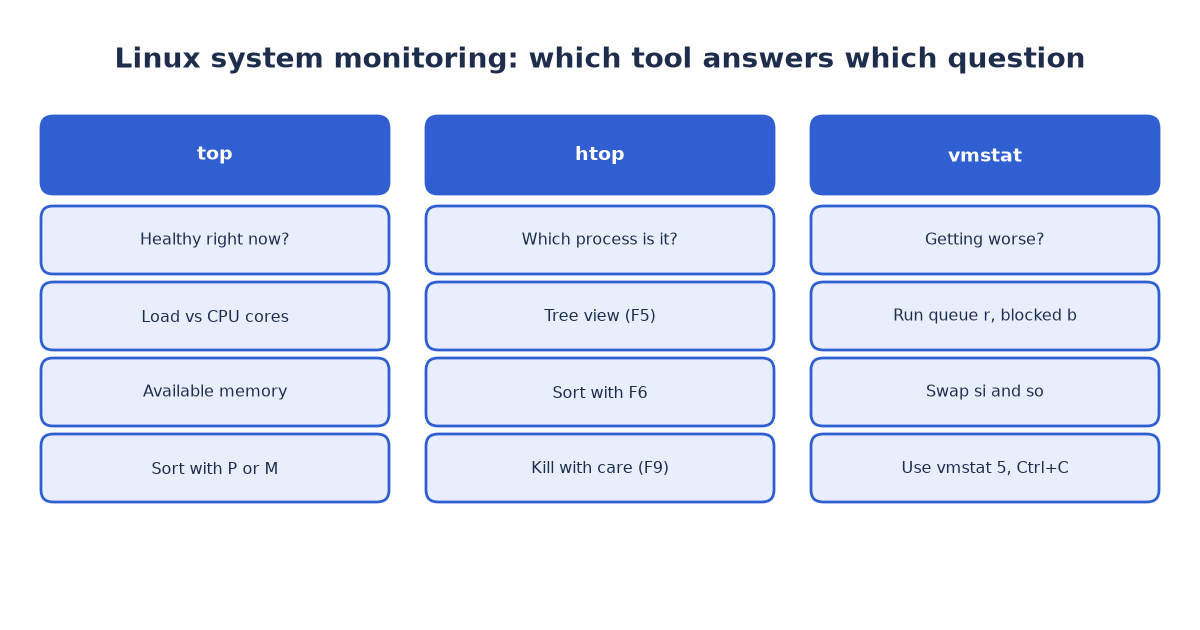
Figure 1: Which tool answers which question in linux system monitoring
Linux system monitoring: three tools, three questions
In practice you answer three questions: is the machine healthy right now, which process is responsible, and is it getting better or worse? The tools map onto them neatly.
- top: a fast, always-available snapshot of processes, CPU and memory.
- htop: a friendlier, color-rich interactive view of the same world, with mouse support.
- vmstat: compact system-wide statistics at a fixed interval, making trends visible: a growing run queue, swapping, I/O.
Experienced admins move between all three. If you are still choosing a provider for that VM, our AWS vs GCP vs OCI for an MVP comparison covers free offers, prices and egress costs.
Before you start: procps and htop
You do not “install top”: top and vmstat both come from the procps package of the procps-ng project, which most distributions ship by default. If it is missing, run `sudo apt install procps` on Debian and Ubuntu or `sudo dnf install procps-ng` on RHEL-family systems such as Rocky Linux, AlmaLinux or Fedora.
htop is a separate package: `sudo apt install htop` or `sudo dnf install htop`; on some RHEL-family systems you may need the EPEL repository first.
top: a health check in one command
Run `top`. The header lines carry the most valuable numbers:
- Load average: the load over the last 1, 5 and 15 minutes, counting processes running, runnable or blocked on I/O. Whether a number is bad depends on your cores: 4.0 saturates a 4-core machine but is comfortable on 8, so always compare the load average with your core count.
- CPU states: us (user programs), sy (kernel work), id (idle), wa (waiting on disk or network I/O) and st (stolen by the hypervisor). High st on a cloud VM means the host is busy with other tenants.
- Memory: free and available are not the same. Linux uses spare RAM as disk cache, so a small free value is normal. Available estimates how much memory applications could really use without swapping – watch that one.
In the process list, `P` sorts by CPU, `M` by memory, `1` toggles a per-CPU view, `k` kills a process (carefully) and `q` quits. From the command line, `top -o %CPU` starts sorted by CPU and `top -U username` shows one user’s processes; both are supported by procps-ng top.
To save a snapshot, use batch mode: `top -b -n 1 > top_output.txt`. The `-b` flag prints plain, non-interactive output and `-n 1` runs one iteration; without it the file fills with control characters.
htop: the interactive upgrade
htop shows the same universe as top but is easier to explore: colored meters for CPU, memory and swap, a scrollable process list and mouse support. Start it with `htop`; the function keys sit along the bottom.
- `F2` opens Setup, where you can configure colors, columns and display options. htop uses color to encode how busy each resource is; adjust the scheme there.
- `F5` switches to a tree view of parent-child process relationships.
- `F6` changes the sort field, for example CPU% or MEM%.
- `F9` sends a kill signal (the same caution as `k` in top); `F10` or `q` quits.
htop is open source and packaged by every major distribution, so it is rarely more than one command away.
vmstat: trends instead of snapshots
vmstat prints one compact line of system-wide statistics per report. The interval is a plain positional argument, not an option:
- `vmstat 5` prints a report every 5 seconds until you stop it.
- `vmstat 5 10` prints 10 reports, 5 seconds apart, then exits.
- `vmstat -t 5` adds a timestamp column, useful when reviewing logs later.
Two details trip people up: the first line is an average since boot, not a live measurement (only the lines that follow describe your interval), and vmstat is not interactive – there is no quit key; stop it with Ctrl+C.
The columns worth understanding:
- r (run queue): processes running or waiting to run. If r stays above your core count, the CPU is the bottleneck.
- b (blocked): processes stuck waiting, usually on I/O. A persistently high b points at disks, not CPU.
- si / so (swap in / swap out): occasional small values are harmless; continuous swapping means you have run out of real memory.
- wa: idle time spent waiting on I/O, the same signal top shows.
To record a log, use `vmstat -n 5 > vmstat_log.txt`: `-n` does not set the interval (a common mistake); it only prints the header once. The 5 is still the interval.
Linux system monitoring in practice: which tool answers which question
For everyday linux system monitoring, a simple mapping works well:
- “Is the machine healthy right now?” Open top or htop and read the header: load versus cores, CPU states, available memory.
- “Which process is responsible?” htop: sort with `F6`, use the tree view with `F5` and follow the chains to the culprit.
- “Is it getting worse, and is it CPU, memory or I/O?” vmstat: watch r, b and si/so across intervals and look at the direction, not one line.
| Tool | Best for | How to start | How to stop |
|---|---|---|---|
| top | A fast health check on any server | Run `top` | Press `q` |
| htop | Interactive exploring: sorting, tree view, colors | Run `htop` | Press `q` or `F10` |
| vmstat | Trends over time: run queue, swap, I/O | Run `vmstat 5` | Press Ctrl+C |
The first 5 minutes when a server feels slow
Work through this routine before you change anything:
- Minute one: run `top`. Compare the load average with your core count and press `1` to see whether all cores are busy or just one – a single pegged core usually means a single-threaded process.
- Minute two: scan the CPU line. High us points at an application, high sy at kernel work, high wa at storage, high st at the virtualization host.
- Minute three: check available memory and the swap si/so figures. Active swapping means memory is your problem.
- Minute four: press `P`, then `M`, and note the top processes by CPU and by memory – your shortlist of suspects.
- Minute five: run `vmstat 5 12` and watch a minute of intervals. Rising r means the run queue is growing, rising b means I/O is backing up, flat numbers suggest the spike has passed.
Only then decide: restart a service, add resources or dig into a process. If a fix looks risky, rehearse it on a staging copy and verify your backups really restore – we walk through that testing process in our WordPress backup and restore guide.
Good linux system monitoring is a habit, not a product: a few minutes with top, htop and vmstat each week tells you more than most dashboards. If you would like a second pair of eyes, we offer a free 30-minute review – book a slot through our contact page or write to info (at) abcsoft (dot) digital. We help teams keep their servers healthy and boring, and boring is what you want in production.
Add a Comment